
Behavior of Sine Graphs
by Hieu Nguyen
To explore sine graph behavior, we must examine the graph(s) created by the equation: y = a sin(bx + c)where as variables a, b, and c are parameters that can be manipulated. The purpose is to explore the behavior of the graph given different values of the given parameters.
We can manipulate each parameter one at a time to explore the changes in the sine graph using Graphing Calculator. Below is a visual example of the graph at a = 1, b = 1, c = 0, where y = sin(x)
![]()
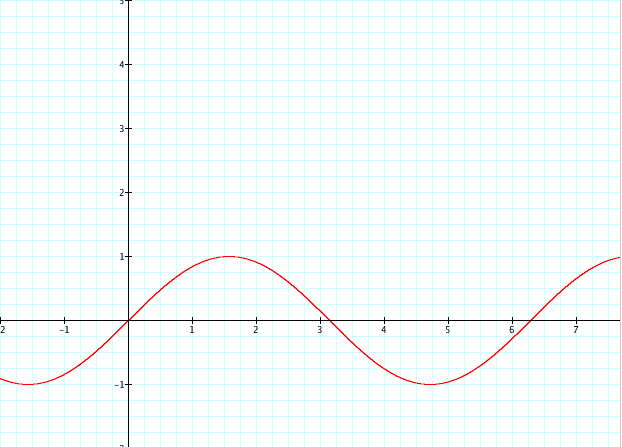
Note that the graph displayed is a typical sine graph with origin at x = 0. The complete cycle of the graph occurs at exactly 2(pi), and the maximum and minimum points are exactly 1 unit from the x-axis.
Now we begin to explore by manipulating the graph by changing the variable a while b = 1 and c = 0 (remains the same), so y = asin(x).
The two graphs below represents the behavior of the sine graph when a = 3, a = -2.
For a = 3, we get the equation y = 3 sin(x), which is overlayed on the graph in comparison to the original y = sin(x) graph.
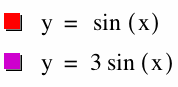
Note that the new graph (purple) is similar to the original sine graph in the manner that the complete cycle still occurs at 2(pi) and that the origin is still defined at x = 0. The change we notice is that the maximum and minimum points are now 3 units away from the x-axis. The change in variable a has affected the magnitude of the sine graph.
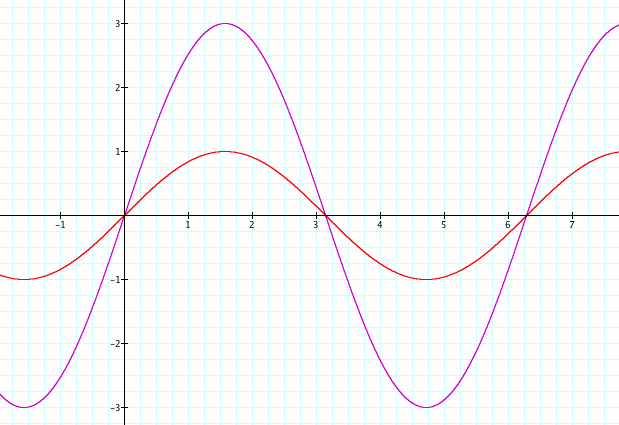
For a = -2, we get the equation y = -2 sin(x), which is overlayed on the graph in comparison to the original y = sin(x) graph.
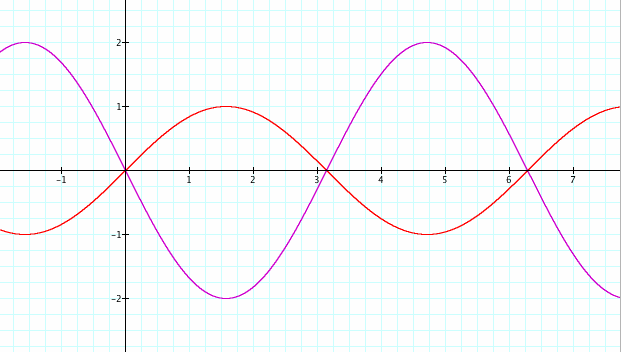
Note that the new graph is similar to the original sine graph in cycle length and origin. The change we notice that the maximum and minimum points are now 2 units away from the x-axis. This means the magnitude has changed as expected; however, we also notice that the direction of the graph changes and that the values begin in the 4th quadrant starting from the origin. The change in variable a can also affect the direction of the sine graph if given an value < 0.
Finally, we can conclude that the variable a has the ability to affect the sine graph by changing its magnitude and direction while keeping the origin and cycle length constant.
Next, we can explore by manipulating the graph by changing the variable b while a = 1 and c = 0 (remains the same), so y =sin(bx).
The two graphs below represents the behavior of the sine graph when b = 3, b = -2.
For b = 3, we get the equation y = sin(3x), which is overlayed on the graph in comparison to the original y = sin(x) graph.
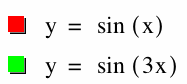
Note that the new graph (green) is similar to the original sine graph in the manner that the magnitude is still 1 unit away from the x-axis and that the origin is still defined at x = 0. The change we notice is that the complete cycle of the graph has changed to (1/3) of 2pi. The change in variable b has affected the frequency of the sine graph and has increased it by the product of the value of b.
For b = -2, we get the equation y = sin(-2x), which is overlayed on the graph in comparison to the original y = sin(x) graph.
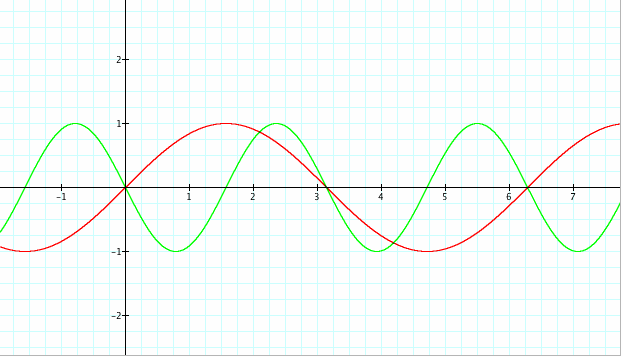
Note that the new graph is similar to the sine graph in origin and magnitude. We notice that the b = -2 has increased the frequency of the cycle length by 2; but also, the negative integer for b has flipped the graph in the same manner as the example where a = -2.
We can now conclude that variable b affects the graphs frequency. It can also change the orientation of the graph if the variable b is an value < 0.
Finally, we can explore by manipulating the graph by changing the variable c while a = 1 and b = 1 (remains the same), so y =sin(x + c).
The two graphs below represents the behavior of the sine graph when c = 3, c = -2.
For c = 3, we get the equation y = sin(x + 3), which is overlayed on the graph in comparison to the original y = sin(x) graph.
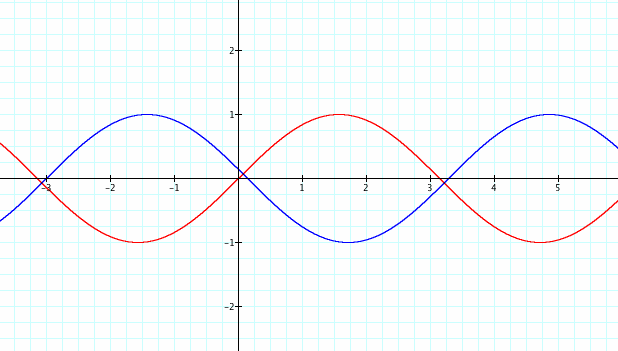
Note that the new graph (blue) is similar to the original sine graph in the manner that the magnitude is still 1 unit away from the x-axis and that cycle lengths are still 2pi. The change we notice is that the origin is now at x = -3 instead of x = 0. The change in variable c has affected the location of the sine graph and has shifted it left by value of b. (We can almost assume that giving the variable c a negative value would shift the graph to the right by that value)
For c = -2, we get the equation y = sin(x - 2), which is overlayed on the graph in comparison to the original y = sin(x) graph.
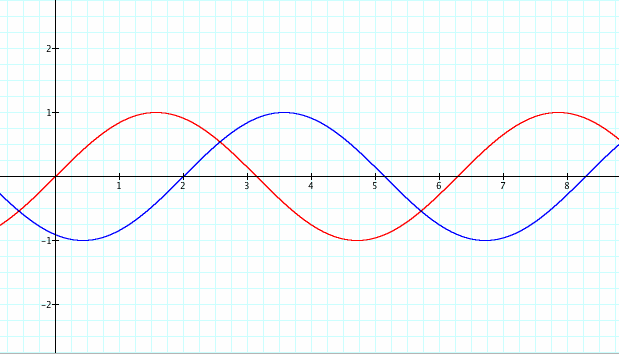
Note that the new graph is similar to the sine graph in cycle length and magnitude. We notice that the c = -2 has shifted the location of the graph 2 units in the positive direction.
We can now conclude that variable c affects the graph location on the x-axis. For values > 0, the graph will shift by the value in the negative x-direction; vice versa, for values < 0, the graph will shift by that value in the positive x-direction.
Overall, we can conclude that variable a affects magnitude and orientation, variable b affects frequency and orientation, and variable c affects location of the sine graph. The assume that the same manipulations can be applied to the cosine graph as well.
Go back to Hieu's HOME PAGE
Go back to EMAT 6680 HOME PAGE